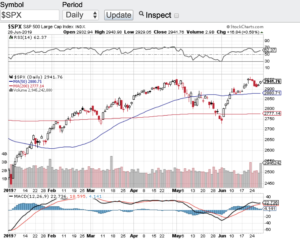
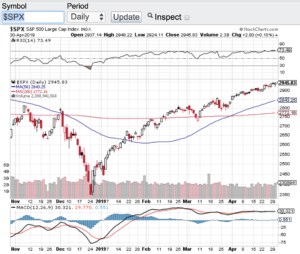
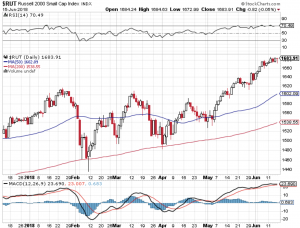
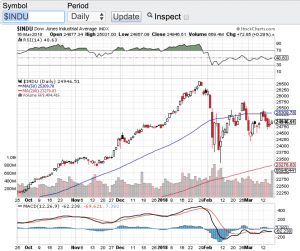
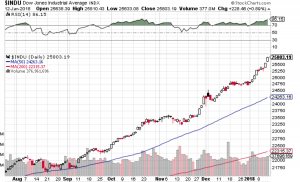
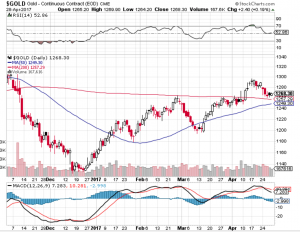
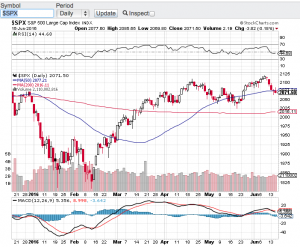
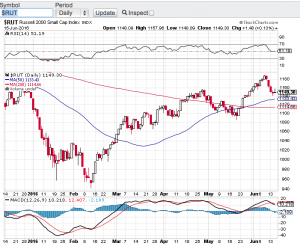
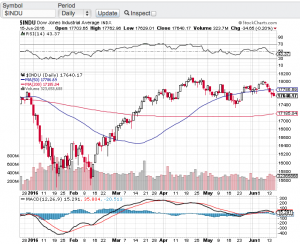
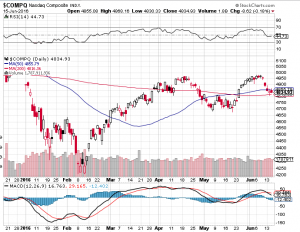
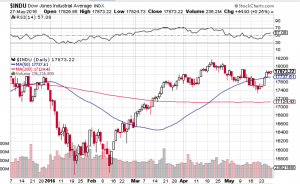
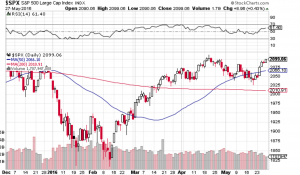
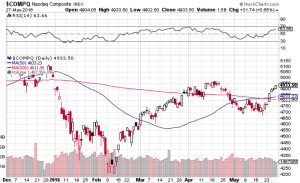
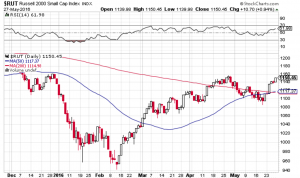
New Year, New Records?

Happy New Year! Will 2018 be a new year of new records? Nothing would surprise me. Especially as the Dow Jones Industrial Average (chart), the S&P 500 (chart), the Nasdaq (chart) and the small-cap Russell 2000 (chart) shattered record after record after record in 2017. In fact the Dow Jones Industrial Average set 70 record closing highs in 2017. That’s not a typo folks, 70 record closing highs. The other aforementioned key indices also set multiple record highs throughout last year. So could we see a repeat performance in 2018? I don’t know about another 70 record highs this year but I would not be surprised to see continuing strength in the markets in 2018. Yes the Federal Reserve is now in a rate hike mode which typically does not bode well for stocks, but this Fed and central banks from around the world understand the need to go about their new rate hike policies in a gradual manner. Raising rates too aggressively could be the exact catalyst to put the brakes on this almost decade long bull market. I don’t think this will be the case at least with our own Federal Reserve. Jerome Powell will be replacing Janet Yellen in early February as our new Federal Reserve Chairman. Mr. Powell who has been a member of the Federal Reserve’s board of governors since 2012 has voted for keeping interest rates at bay while the economy continues to recover.

Speaking of the economy, expansion continues to occur and we will soon find out how our economy is  trickling down into corporate America. Fourth quarter earnings reporting season will begin here in January and this could very well serve as a key catalyst for the continuation of the bull market. That said, I think most investors and traders are looking for the markets to pause and pullback from this historic run we continue to be on. It is truly breathtaking to witness the record pace that stocks have enjoyed for years now. Personally, I hope and some point in time we do get a meaningful pullback so we can have the opportunity to step in at lower prices. Good luck to all and Paula and I wish everyone the healthiest and happiest new year! 🙂

~George

Big Time For Big Tech!

Large cap tech stocks have taken center stage this earnings reporting season big time! Absolute blowout earnings reports came in from Amazon (NasdaqGS: AMZN), the parent company of Google, Alphabet (NasdaqGS: GOOGL) and the elders of the group Intel Corp (NasdaqGS: INTC) and Microsoft (NasdaqGS: MSFT). These tech titans are the latest reason for the Nasdaq (chart) and S&P 500 (chart) to reach and close at record highs yet again. The Dow Jones Industrial Average (chart) and the small-cap Russell 2000 (chart) are also within striking distance of their all times highs. Market observers have attributed the strength in stocks this year to a continuing low interest rate environment and the upcoming new tax policy from the Trump administration. This I get, however, no one can deny the growth that is happening in the tech world as well as other sectors of the economy.

The one note of caution I have here is the exuberant environment we find ourselves in with record highs happening weekly and in some instances daily. Yes earnings reporting season so far has been stellar but let’s not forget that we have not seen price to earnings ratios this elevated in quite some time. The question that now comes to mind are the markets and the aforementioned stocks finally at fair value? Especially as the p/e’s increase and as we approach a much higher interest rate environment over the next two years. We have been in such an accommodative monetary state for almost a decade which without a doubt has been the catalyst for equities and indexes and now the federal reserve here in the U.S. is reversing course. One of the groups that get the most affected in a higher interest rate environment are growths stocks like the aforementioned tech titans.

I am not suggesting that these stocks will not continue their upward trajectory, but I am making note and will be paying closer attention to the overall price to earnings ratios of the indexes and of high growth stocks in general as p/e’s continue to elevate. Good luck to all 🙂

~George

Looks Like A Double Top…

A recent attempt to breakout to all-time highs has seemingly failed. The Dow Jones Industrial Average (see chart below) , the tech-focused Nasdaq (see chart below), the S&P 500 (see chart below) and the small-cap Russell 2000 (see chart below) all appear to have “double topped” and have retreated to support lines. Without question growth concerns here in the United States are abound. These concerns escalated right after the release of May jobs report which was dismal to say the least. Couple these concerns with the potential of the United Kingdom leaving the European Union and its no wonder why the markets have pulled back over the past couple of weeks.

One of the risks to the markets that I highlighted in my last blog were interest rates. It appeared at the beginning of the month that the Federal Reserve and market pundits were all but certain that a rate hike would occur at today’s Federal Reserve meeting. Well thanks to the underwhelming May jobs report, no rate hike occurred this month and furthermore the Federal Reserve have lowered their outlook for any near term future increases! The Fed did say that they will be monitoring our economy and the data to guide them in their future policy decisions and sure enough they continue to stand by this protocol.

Now what? First for me, I want to see how the market reacts to next Thursday’s vote as to whether or not Britain leaves the European Union? Momentum does appear to be increasing for a British exit, which could lead to a global slowdown? Nobody knows if the referendum will pass or what type of effect this will have across the pond or here in the U.S. In the meantime, I will be monitoring the technical shape of our key indices and as you can see in the below charts each of these indexes have found support at either the 20-day, 50-day or 200-day moving averages.

Good luck to all 🙂

~George Mahfouz, Jr.

george mahfouz jr SPX chart

george mahfouz, jr Russell chart


george mahfouz jr Dow chart

george mahfouz jr nasdaq chart

Rate Hikes Are Looming…

Janet Yellen the chair of the Federal Reserve last Friday signaled that the Federal Reserve is prepared to raise interest rates in the coming months should the U.S. economy continue to improve. Some pundits suggest that a rate hike could come at the Fed’s next policy meeting in two weeks. Despite the rate hike chatter, the markets continue to shrug off what seemingly could be bearish for stocks. The Dow Jones Industrial Average (see chart below) is within striking distance of all time highs. Same can be said for the S&P 500 (see chart below), the Nasdaq (see chart below) finds itself flirting once again with the 5000 mark and the small-cap Russell 2000 (see chart below) appears to have caught a bid and is strengthening.

This type of market activity is counterintuitive when interest rates appear to be heading north. The flip side to this thinking is if the Federal Reserve is willing to raise rates due to a stronger economic back-drop, one can assume that this must be good for corporate America. Logically speaking I agree, however, if history has anything to do with the markets, a rising interest rate environment typically does not bode well for equities. Couple this with the seasonality of the summer months which tend to be weaker months for stocks and the upcoming fall presidential election, and I would say at the very least we will see a rise in volatility. These are very powerful forces that are lining up and I think it’s safe to say the markets will be very reactive to these events.

So what’s a trader or investor do in this landscape? For me personally I think the type of environment we are heading into creates opportunity on the long and short side. I will be paying close attention to overbought and oversold conditions of the markets and select equities throughout the summer and into the fall. As everyone knows by now my favorite technical indicator when it comes to spotting overbought/oversold conditions is the Relative Strength Index also known as the RSI. Many market technicians also favor this technical indicator when assessing market conditions from a technical standpoint. Over the years the RSI has demonstrated its usefulness and if you are not familiar with this technical indicator, you may want to research it out. Click here for starters.

Both Paula and I wish everyone a very safe, prosperous investing and trading summer 🙂

~George Mahfouz, Jr.

Screen Shot 2016-05-30 at 8.00.40 PMGeorge Mahfouz Jr. S&P 500 chartGeorge Mahfouz Jr. Nasdaq ChartGeorge Mahfouz Jr. Russell 2000 Chart


Happy New Year!

2015 essentially proved to be a flat to down year for stocks taking some investors and traders by surprise. The Dow Jones Industrial Average (chart) closed the year down 2.2%, the S&P 500 (chart) minus dividends closed down just under 1%, the Nasdaq (chart) closed up 5.73% and the small-cap Russell 2000 (chart) closed the year down 5.71%. What’s more is how crude oil (chart) fared in 2015 declining more than 30% which also had weighed heavily on the aforementioned indices.

Looking ahead to this year, stocks find themselves in a place where they haven’t been in quite sometime and that is a rising interest rate environment. Historically speaking, equities tend to be under pressure at the beginning of and throughout a rate hike cycle with the exception of cyclical stocks and certain commodities. However this time may be different. In the past when the Federal Reserve begins to raise interest rates it is usually to fend off inflation and/or to cool off the economy when it becomes too hot. From my view and from the data flow, this is not the environment we find ourselves in today. So I do not expect that the Federal Reserve would raise rates aggressively or too quickly. With that said, the markets might not trade the way they would if we were in an inflationary environment with rising interest rates. Nonetheless, I do think that more volatility will come into stocks in 2016 and it will become more of a stock pickers market.

Furthermore, the technical shape of the market appears to be setting up for more downward movement as the key indexes have breached or are about to breach their respective 200-day moving averages. However, it would take days of trading below their 200-day to set off an alarm at least from a technical perspective. Let’s see how the first week of trading in the new year plays out before making any sort of definitive technical opinion.

Both Paula and I sincerely wish everyone the healthiest, happiest, safest and most prosperus New Year yet 🙂

~George

Finally The Fed Raises Rates!

After 9 years of essentiality zero percent interest rates, the Federal Reserve today raised its benchmark interest rate one quarter of one point. Investor’s embraced the Fed’s action lifting all of the key major averages. The Dow Jones Industrial Average (chart) closed up 224 points, the Nasdaq (chart) up 76 points, the S&P 500 (chart) up 29 points and the small-cap Russell 2000 (chart) closed out the session up 17 points. The street gained confidence when Fed officials also provided clarity as to their upcoming intentions regarding further rate hikes. Such hikes would only move up between 0.25% and 0.5% and would be subject to future economic activity and data. Another takeaway today is that the Federal Reserve has enough confidence in the current economy to raise rates and confidence in future growth in the foreseeable future. If you are bullish on the markets it doesn’t get better than this. Which is a tepid Federal Reserve while considering raising rates and an economic backdrop that seemingly is demonstrating growth albeit in a moderate manner.

So which sectors could benefit the most from a rising interest rate environment? One sector I will turn my attention to is the banking sector. Banks tend to earn more when rates move up simply because they can charge more interest on the loans they make. There are individual bank names that one can consider but for me personally I would rather position myself in the largest banking exchange traded fund (ETF) Symbol: XLF. The XLF’s top holdings include the likes of Wells Fargo & Company (NYSE: WFC), JP Morgan Chase (NYSE: JPM), Bank of America (NYSE: BAC) Citigroup (NYSE: C) and Goldman Sachs (NYSE: GS) just to name a few. So you get the diversity of multiple money center banks and other banking related institutions which spreads out some risk. That said, it is best practice to consult with your financial advisor(s) before making any investment decisions.

I do think that investors and traders alike can now breathe a sigh of relief now that the Fed has made its first move and the markets cheered that with enthusiasm. Good luck to all!

Both Paula and I wish everyone a very safe and happy holiday season 🙂

~George

Interest Rate Hike Fears Spook Stocks…

Since the release of the February labor market report, which was much stronger than the street expected, stocks have been on a wild ride. Triple digits gains and losses have occurred this past week with the Dow Jones Industrial Average (chart) In addition, the S&P 500 (chart), the Nasdaq (chart) and the small-cap Russell 2000 (chart) have all pulled back noticeably since the February jobs report was issued. So wait a minute, a strong labor market is good for the economy, hence, good for stocks too right? Logically speaking yes, but as it pertains to the Federal Reserve, a stronger labor market and a stronger economy gives them the green light to begin to raise interest rates.

This is what is now permeating through the stock market. The concern is that the Federal Reserve has enough data to begin to change their stance on their multi-year accommodative financial policies, policies that have benefited equities since 2009. We may not have to wait too much longer to gauge the Fed’s stance as it prepares for next week’s Federal Open Market Committee meeting. I think the anxiety we are witnessing may be a little exaggerated. It’s normal to have emotions play out and even take control over investors, however, people seem to forget that the Fed has been extremely cautious as to even eking out the wrong language in their official policy statements. I would not expect the Fed to shock the markets by raising rates too early or too aggressively. That said, I do expect volatility to continue and for markets to get “emotionally” charged. We could very well be in the midst of yet another dip back to the 200-day moving averages of the aforementioned key indices and should that occur, I would expect that buyers would come in bargain hunting. Over the past few years, the 200-day moving average has acted as significant support for these key indexes. The only difference and question now would be, is if the Federal Reserve indeed changes their position on interest rates, how well would this favorite technical indicator fare? Good luck to all and have a great week 🙂

~George


Where are they now?

Just a mere 2 weeks ago the pundits came out in full force declaring the end of the bull market or at the very least a 10-20% correction for stocks. Fast forward to today and we find ourselves yet again in record breaking territory. For the month of May, the Dow Jones Industrial Average (chart) closed up 0.82% at a new record closing high of 16,717.17, the Nasdaq (chart) closed the month up 3.11% at 4242.61, the S&P 500 (chart) closed at an all time record high of 1923.57 and the small-cap Russell 2000 (chart) closed out May up 0.68% at 1134.50.

In my previous blog I wrote about certain experts calling for an imminent correction in which I thought was a bit pre-mature considering how the Federal Reserve continues to accommodate the economy and the markets. I understand where the bear camp is coming from, as soon as the Fed begins to hike interest rates, we should indeed see the markets react accordingly. The problem with the sell-side thesis is this just isn’t happening now. Policymakers continue to reiterate their stance on interest rates which are to remain low for the foreseeable future as the bond tapering program continues and ultimately exhausts itself, which could be by year-end. Then I think bear growl may have a lot more punch to it.

So how do we continue to make money in an environment that continues to make record highs seemingly with no end in sight? In addition to honoring the power of the Fed, I will continue to refer to the technical shape of the key indices to spot opportunities as we wait for the second quarter to wind down. With the incessant “melt-up” of the markets, one may think that stocks maybe overbought a bit. This most certainly is the case with select individual stocks, however, as I look at the closely followed Dow (chart), Nasdaq (chart), S&P 500 (chart) and the Russell 2000 (chart), none of these indexes are in overbought territory at least according to their respective Relative Strength Indexes. Remember, the Relative Strength Index (RSI) is a technical indicator which signifies whether or not a stock or index is overbought or oversold, with the 70 plus value level indicating an overbought condition, and the 30 minus level indicating an oversold condition. Click here for the expanded definition of the RSI. In addition, all of the moving averages are intact for the aforementioned indexes. Click here for the moving averages definition.

So as we enter the month of June, I am expecting the continuation of the “melt up” that has occurred so far this year with modest pullbacks. Of course as we witnessed in mid-May, sentiment can change quickly and the pundits and press for that matter can spread fear like wild fire, and should this be the case, I will prepare myself to add to certain long positions to take advantage of any potential weakness. As always, it is best practice to consult with a trusted financial advisor(s) before making any investment decisions. Good luck to all 🙂

~George


Global Concerns Give Markets A Pause…

Stocks had a very volatile week as tensions elevated in Ukraine and now China has seemingly hit a soft patch in its economy. For the week, the Dow Jones Industrial Average (chart) fell 2..35%, the Nasdaq (chart) gave back 2.09%, the S&P 500 (chart) -1.96% and the small-cap Russell 2000 (chart) ended the week lower by 1.82%. I do not think the most recent retreat in stocks is anything beyond the current global headline risks as our own economy appears to be intact and growing, albeit modestly. Some economists believe China will maintain a 7.5% growth rate this year while other pundits believe a cooling off of China’s economy would affect our markets here. Should the latter be the case, I would assume the Chinese government would take measures to help prop up their economy by injecting enough stimulus to ensure the targeted 7.5% growth rate for 2014 would not be breached. Recently, the economic numbers across the board coming out of China has been weaker than expected, especially in the manufacturing and export sectors.

This past week also saw an escalation in the crisis in Ukraine with both sides increasing the chatter about a potential military conflict as protests have become extremely violent. Governments from around the world are now are attempting to assist in the negotiations with Russia and Ukraine to formalize some type of accord. So it’s no surprise that a “risk off” mentality has come into the markets for the time being. I do believe that once things settle down in the Ukraine and the China headlines become less frequent, we could consolidate here for a bit as the first quarter of the year winds down. Then of course as we enter into April, all eyes will be watching how corporate America fared during the first quarter as Q1 earnings reporting season will begin. Between now and the end of March, I will be paying closer attention to our own economic data which will most likely translate into companies Q1 earnings reports.

Technically speaking, the Dow Jones Industrial Average (chart), the Nasdaq (chart), the S&P 500 (chart) and the Russell 2000 (chart) all appear to be heading towards their respective 50-day moving averages, in fact the Dow (chart)  actually breached its 50-day on Friday. The 50-day moving average is a technical indicator I favor as do other certain market technicians. Historically, when stocks or indexes reach their 50-day or 200-day moving average for that matter, support is typically found and a reversal of the stock or index ensues. The moving averages are also followed by certain institutional investors and select computerized algorithmic trading models, which could also be a reason why the moving averages can act as a support mechanism. Now I am not suggesting that the moving averages are infallible, I personally utilize this indicator mainly from a technical standpoint to help me navigate current market opportunities. Good luck to all.

Have a great weekend 🙂

~George