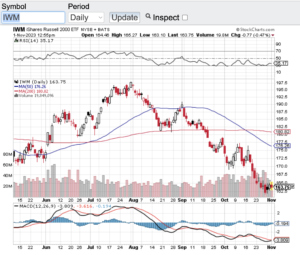
Healthy Corrective Action – Or Something More?

Are we in a healthy correction or is this something more? The recent market selloff including yesterday’s 500 point drop on the Dow Jones Industrial Average (see chart here) has caught the attention of investors and traders alike. The S&P 500 (see chart here) experienced its toughest month in over a year closing down almost 5%. The Nasdaq Composite (see chart here) was lower by over 5% in the month of September. It is not too surprising that the major averages were weaker to close out the third quarter. Historically, September and October for that matter are usually softer months for stocks.

So back to the question is this healthy corrective action or the beginning of a meaningful drawdown? The answer depends on who you ask or how you are interpreting the Federal Reserve’s updated guidance to the monetary policies that the Fed has in place. It is hard to be bearish here based on where the Federal Reserve currently stands. In one breath we hear that “bond purchases” will start to taper off before year end. Then in another breath, the Fed continues to signal that they are prepared to support our economy in the event we experience another surge in Covid. My feelings are the Fed will not put the brakes on their easy monetary policies until such time that our country is out of this pandemic. One thing is for sure, each upcoming Fed policy meeting and subsequent guidance will be put under a microscope more now than ever.

Let’s take a quick gander at the technical shape of the aforementioned indexes. The Dow Jones Industrial Average (see chart here) closed yesterday just below 34000 with its 200-day moving average currently at 33360. The S&P 500 (see chart here) closed yesterday at 4307 while also breaching and closing below its 100-day moving average. The Nasdaq Composite (see chart below) closed the month of September at 14448 also breaching its 100-day moving average. So the current technical set up could mean more downside ahead, but on the other hand, if these moving averages hold and acts as support, we could see a strong relief rally.

Good luck to all 🙂

~George

Healthy Corrective Action - Or Something More? - Paula Mahfouz


53 Record Highs And Counting…

The S&P 500 (see chart here) has hit 53 record highs so far in 2021 and counting. That’s right folks 53 all-time highs this year alone. The Nasdaq Composite (see chart here) has logged 32 record highs in 2021 as well. The Dow Jones Industrial Average (see chart here) has also been on fire trading above the 35000 level and the small-cap Russell 2000 (see chart below) continues to perform alongside the aforementioned bellwether indexes. How much longer can this bull run? I think it began with the Federal Reserve and its longstanding monetary policies and now there seems to be a subtle change in the Fed’s position.

Last Friday at the Federal Reserve’s Jackson Hole Economic Symposium, Fed Reserve chairman Jerome Powell signaled again that the Fed would soon begin to pullback on its $120B per month bond asset purchases. This support to the markets and the economy along with a zero percent interest rate backdrop has been THE catalyst to support record high after record high in our stock market. Of course the massive economic stimulus packages that have been disseminated since the start of the pandemic has also played a role in consumer spending which has also propelled stocks to new heights.

Now we all know this cannot go on forever. Free money, zero percent interest rates, asset purchases and the like will end at some point in time. The question then becomes what happens to the stock market when all of this support winds down? Friends the answer is simple. Corporate America is going to have to produce on its own. Meaning this, for the continuation of this decade long bull market, companies will have to not only have to catch up with their current valuations they will have to exceed expectations going forward. This will certainly separate real growth companies from the rest of the pack and that’s when we just may see a more normal ebb and flow in our markets. Good luck to all 🙂 and have a safe and Happy Labor Day weekend.

~George

53 In a Row And Counting - Paula Mahfouz


Nowhere Near Raising Rates…

In the words of Fed Chairman Jerome Powell “the Fed is nowhere near considering raising rates”! Last Wednesday the Federal Reserve held its FOMC meeting where it kept interest rates essentially at zero. This despite inflation seemingly everywhere along with a strengthening economy. So, what gives? Without question the most recent spike in Covid cases across our country continues to keep the Fed at bay pertaining to rates. I do get the thinking and strategy; however, I am a bit concerned of inflation overheating and the continuation of record setting asset prices.

Last week three of the four major averages hit all-time record highs. The Dow Jones Industrial Average (see chart here) hit an all-time high of 35171. On Thursday the S&P 500 (see chart here) notched a record high of 4429 and the Nasdaq Composite (see chart here) booked a record high of 14863. The small-cap Russell 2000 (see chart below) is the one index that is lagging a bit but the uptrend there remains intact.

As mentioned above, I am a bit concerned as to the non-stop record setting ways with asset prices. There seems to be a growing concern on the street about the potential ramifications of easy monetary policies that have been in place for over a decade and counting. There is no question interest rates need to go up and the money printing needs to abate. Yes, we are in a once in a century pandemic and there has been no choice other than to flood the markets with stimulus and support. However, this cannot go on forever.

That said, as I look at the technical shape of the aforementioned key indexes, there are currently no problems there. Three of the four indices that just set records last week all remain above their respective 20-day, 100 and 200-day moving averages. Also, these indexes are not yet overbought according to the relative strength index aka the RSI. So, folks it appears the record setting ways of our markets should continue in the near term. Make sure to always consult with a certified financial advisor(s) before making any decisions and/or adjustments to your investment strategies.

Good luck to all 🙂

~George

Nowhere Near Raising Rates - Paula Mahfouz

No June Swoon This Year…

No June swoon this year, these markets are simply not having it. June historically can be either a slow month or a month of selling pressure. Neither really happened this year. Despite a brief dip in the major averages a couple of weeks back due to inflation concerns, stocks and indexes held their own last month. The Dow Jones Industrial Average (see chart here) closed out the month at 34502, the S&P 500 (see chart here) finished the month just shy of 4400, the Nasdaq Composite (see chart here) closed out the month in record territory at 14503 and the small-cap Russell 2000 (see chart below) finished the month and first half of the year at 2310.

I remain in awe of the resiliency of stocks and most every other asset class out there. I read the other day that Facebook (NasdaqGS: FB) has become the fifth company in the United States to surpass the $1 trillion value mark. We now have in our country five companies that are valued at over $1 trillion dollars. Apple (NasdaqGS: AAPL), Amazon (NasdaqGS: AMZN), Microsoft (NasdaqGS: MSFT) and Alphabet aka Google (NasdaqGS: GOOGL) round out the top five trillion-dollar companies. When I see this type of action it makes me wonder how much earnings power do these companies need to continue to exhibit in order to keep their eye-popping valuations going? One other obvious similarity is the companies are all tech stocks and that is where the real growth has been. If you go back 20 years, I don’t think anyone would of expected five companies in our markets all reaching and boasting trillion dollar plus valuations. Heck, Microsoft’s market cap just surpassed $2 trillion dollars to join Apple as the only companies with more than a $2 trillion dollar valuation. Folks I am not a forensic analyst, but my goodness how is the law of large numbers playing a role here?

As I look at the technical shape of the major averages nothing really stands out to me with the exception of the Nasdaq Composite (see chart here). The Nasdaq has just entered overbought territory according to the relative strength index aka the RSI. The Nasdaq also just hit an all-time high so I think some sort of pullback could potentially be in the offing.

Have a safe and happy 4th of July weekend 🙂

~George

No June Swoon This Year - Paula Mahfouz


Risk On Remains On!

Risk on in the markets remains on as we approach the second half of the year! It’s truly remarkable to me how stocks, crypto, real estate and other asset classes are still trading at or near all time highs. I do get that the ongoing accommodative policies provided by our Federal Reserve and from central banks across the globe is the main reason why asset prices continue their bullish ways.

That said, I do think it is time to start considering how things could look once the Federal Reserve in our country starts backing away from its accommodative monetary policies and as interest rates begin to normalize. This is not a question of if, it’s a question of when. Tell tale signs of inflation are now seemingly everywhere which is what the Federal Reserve is paying close attention to and could be the catalyst for the Fed to act. It is at this point our markets could be adjusting to align with real interest rates and normalized price to earning multiples. To that end, we have and continue to witness the most unique market conditions ever seen. So I am not calling a top here and I do respect the power of the Federal Reserve, however, I am just suggesting that we may see a healthy and overdue adjustment in asset prices which may not be such a bad thing. There are many investors that are on the sidelines and would be more than happy to step in should we see asset prices adjust to a lower entry point.

Let’s take a quick look at the technical shape of the major averages. The Dow Jones Industrial Average (see chart here), the S&P 500 (see chart here), the Nasdaq Composite (see chart here) and the Small Cap Russell 2000 (see chart below) all are trading above their 20, 100 and 200 day moving averages. This alone is a strong technical backdrop and what’s more is none of the aforementioned indexes are currently overbought according to the relative strength index aka the RSI. So technically speaking things look pretty good right now.

Good luck to all 🙂

~George

Risk On Remains On - Paula Mahfouz


Big Tech Blowout!

Big tech absolutely blew out their earnings in their most recent quarter. Let’s start with Apple; Apple (NasdaqGS:AAPL) experienced growth in each of its product categories. What’s truly unbelievable is Apple generated about a $billion dollars a day in revenue. Yes, no typo folks, a billion a day in revs in their most recent quarter. Facebook (NasdaqGS: FB) also crushed their quarter generating over $26 billion in revenues easily beating analysts expectations of $23 billion and Facebook’s earnings per share exceeded analysts’ expectations by 40%. Alphabet’s (NasdaqGS: GOOGL) quarter was also quite stellar posting revenues of $55 billion which is up over 30% from the same period a year ago and last but not least Microsoft (NasdaqGS: MSFT) posted revenue of over $41 Billion up almost 20% over for the same period last year. To me this is breathtaking on how these mega-cap companies continue to grow at such a high clip completely ignoring the “law of large numbers” .

So off to the races for the aforementioned stocks right? Not so fast. Despite popping after releasing their earnings, these stocks have started to trade lower. This could be a sign that these earnings reports were already baked into the price already. Of course, it is not uncommon for stocks to become a bit exhausted especially after the tear that the markets have been on so far this year. Let’s see how next week fares in whether or not the lack of follow through to the upside now that earnings are out.

As I look at the overall technical shape of the markets the Nasdaq Composite (see chart here), the Dow Jones Industrial Average (see chart here), the S&P 500 (see chart here) and the small-cap Russell 2000 (see chart here) are not currently overbought according to the relative strength index. What’s more is these indexes also remain comfortably above their respective 100 and 200 day moving averages and are finding current support at their 20-day MA.

Good luck to all 🙂

~George


Record Highs Again!

Record highs were hit again this week as both the Dow Jones Industrial Average (see chart here) and the S&P 500 (see chart here) continue to plow ahead. However, not the same can be said for the Nasdaq Composite (see chart here) and the small-cap Russell 2000 (see chart here). Both of these indexes have lagged behind the Dow and S&P torrid pace.

As with technology and small-cap stocks, when interest rates begin to move up these sectors begin to take notice. The 10-year treasury yield is one of the go to benchmarks that professional money managers key in on. This week the 10-year yield touched a one year high of 1.77% (see chart here). It’s easy to look at that yield and think that this yield is not that high at all. However, when you realize that just last summer the yield on these bills were at 1/2 of 1 percent, the move up to 1.77% does stand out. This sharp move from off the lows of 2020 is what has caught the eye of professional money managers that value high growth companies. It is clear that a full rotation out of high multiple stocks has not occurred yet, but higher interest rates and the threat of the continuation of higher interest rates seem to be the reason why the Nasdaq Composite (see chart below) and the small-cap Russell 2000 (see chart here) have lagged.

Now that the first quarter of 2021 has ended, Q1 earnings reporting season is on the horizon. I am not sure what to expect out of corporate America pertaining to top or bottom line growth. We find ourselves at what appears to be the start of coming out of the pandemic with some degree of normalcy. I would not be surprised if corporate America is bullish on their quarterly conference calls and speak directly to the early results of the vaccine deployment and the change that they are seeing in their customers behavior and spirits.

Good luck to all -)

~George

Record Highs Again! - Paula Mahfouz


Does It Feel A Bit Bubbly?

Do the markets feel a bit bubbly to you? This question is beginning to surface more frequently lately and I think it’s a great question to be asking. The majority of asset classes seemingly have gone straight up without pause over the past several months. Whether it’s the stock market as a whole, the crypto space or one of the hottest trends lately are SPAC’s. What is a SPAC? A SPAC is a special purpose acquisition vehicle that is publicly traded but has no assets other than cash. These vehicles are specifically designed to form as a public company, raise capital and then seek out companies to acquire. For example the electric vehicle space has been one of the favorite sectors for SPAC’s to target over the past year. This is a much easier pathway for private companies to go public without having to go through the time and expense of a traditional IPO.

One of the problems that is happening with the SPAC trade is once they identify a target and move to acquire it, the valuations of these SPAC’s begin to rise steadily into the nosebleed section of the markets. So much speculation is occurring with these SPAC’s institutional and retail investors are willing to pay essentially any price to get on board. Let’s not forget about the day traders that add fuel to the rise in these SPAC’s. So between all of the above and now with interest rates starting to tick up, it’s now wonder we have witnessed over a 1000 point drop in the Dow Jones Industrial Average (see chart here) to close out last week. Now let’s look at the technical shape of the major averages.

The Dow Jones Industrial Average (see chart below), the S&P 500 (see chart here), the Nasdaq Composite (see chart here) and the small-cap Russell 2000 (see chart here) over the past few trading sessions have all dropped below their respective 20-day moving averages and are finding support at their 50-day. Let’s see if these key indices can hold their 50-day moving average support zone this week. If they can the uptrend could very well remain intact, if not, we could see late last weeks selling pressure continue.

Good luck to all 🙂

~George

Does It Feel Bubbly? - Paula Mahfouz

What In The World?

What in the world is going on in the stock market? Millions of retail investors have formed an alliance and have taken on short hedge funds. Who would of thought that we would see the day that hedge funds that are specifically designed to short stocks would run into a short squeeze from an online trading group? This is what’s happening right now with GameStop (NYSE: GME) (click here for the definition of short selling). For decades these short hedge funds have targeted companies that appear to have weak fundamentals and no real prospects for growth which is why they targeted GameStop. The brick-and- mortar electronics retailer inherent business model has been challenged over the years due to the rise of digital gaming.

So, an obvious short, right? Fundamentally yes, but what has happened to the stock of GameStop is unprecedented. Never before has a unified online retail investor/day trading group targeted a company in the way that GameStop has been targeted while also targeting hedge funds that short sell companies. GameStop soared to a high of $483 per share last week while not that long ago GameStop was trading in the teens. In the month of January have witnessed unheard of returns with not only GameStop, but also with AMC Entertainment Holdings (NYSE: AMC) and department store Macy’s (NYSE:M) just to name a few. Pundits now are speaking to how this new “retail investor/day trading” strategy and cult like initiative is here to stay. Talk about disrupting the markets and impacting the short sellers’ model forever! I too believe this here to stay. That said, I also believe regulation will come forward to address the unimaginable volatility that these targeted stocks are experiencing. $200 dollar +/- price swings is happening with GameStop (see chart below) on an intraday basis that have even made the most experienced day and swing traders scratch their heads on how to trade the stock.

In closing, this is pure speculation and has no fundamental basis. Everyone knows GameStop is not worth $300-$483 per share not even close. To that end, this is a reminder of how stocks and stock prices can totally be disconnected to the fundamental value of a company. Please be careful trading these kinds of situations and it’s probably best to stay away!

Good luck to all 🙂

~George

What In The World? - Paula Mahfouz


2021 Is Here…

2021 is here and it could not of come fast enough. Happy New Year and I think we can all use a fresh start! The year 2020 was one of the most challenging years our country and the world has faced. One of the only exceptions that did not face many challenges is the stock market. Despite the global pandemic we remain in and the non-stop chaos out of Washington DC, the major averages set record highs throughout the year. Who would of thought that stocks and market speculation would be at such a fever pitch considering the backdrop of 2020. During this latest bull market surge one thing that stands out to me is how margin debt has hit all time highs. Investors have borrowed over $700 billion dollars against their portfolios which is also a new record. This is somewhat alarming because when the market experiences a correction, margin debt can accelerate any meaningful selloff. Some investors could be forced to sell if their margin debt becomes disproportionate to their overall account value. That said, when record highs continue to be set the risk of margin debt tends to be overlooked.

Speaking of record highs, both the Dow Jones Industrial Average (see chart here) and the S&P 500 (see chart here) set new records on the last trading day of the year. The Nasdaq Composite (see chart here) and the Russell 2000 (see chart below) also set records earlier in the week. Although stocks and indexes feel overbought, we are not seeing extreme overbought conditions according the the relative strength index also know as the RSI. There is also support in place at the 20-day, 50-day, 100 and 200-day moving averages. So technically speaking the key indices appear to be in good shape. This set-up bodes well for the continuation of the market rally that we are in.

Of course there are risks out there that could temper the record setting enthusiasm. One risk in particular is the upcoming runoff election in Georgia next week. If the democrats take control of the Senate, this could be viewed as a negative for stocks. The markets historically have liked when there is a split majority between the House and Senate. Pundits argue that a Democratic President and a Democrat controlled Congress could affect income and capital gains taxes that would negatively impact stocks. I am not sure if this will play out but nonetheless as we continue down this bull market path we should not be lullabied to sleep with the risks out there. Good luck to all 🙂

~George

2021 Is Here - Paula Mahfouz