Did Apple Just Save Tech?

Tech stocks have been battered lately but as in the past Apple just might of saved tech stocks, at least for the time being. After the close, Apple reported an astonishing $53 billion in revenues growing at a 17% clip. What’s more is Apple’s profits rose more than 30% coming in at a whopping $11.5 billion in profits. I thought there is a thing called the law of large numbers? Apparently not at Apple! People don’t realize how hard it is to grow a company of this size in the way Apple continues to grow. Year after year, quarter after quarter, simply amazing. The question now becomes is yesterday’s earnings beat by Apple enough to put a floor in tech stocks. Technology stocks have been taken out to the woodshed as of late with seemingly no end in sight, until yesterday. What I will be looking for today and for the rest of the week is whether or not companies continue get sold off after their earnings release which has been the trend this particular earnings reporting season.

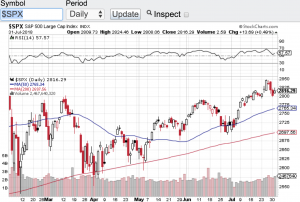
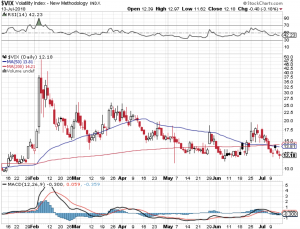
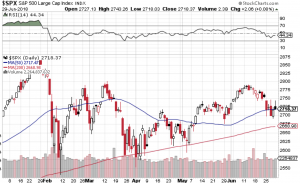
In my last blog I eluded to the possibility of a breakout of the S&P 500 (chart) or a triple top fade in the index.Β  Quite honestly neither really happened, at least not yet. The S&P 500 (see chart below) essentially has been trading in a range between 2800 and 2850. Earnings reporting season has yet to be the catalyst for such a breakout or breakdown for that matter. Triple tops are very powerful to the technical set-up on any given index or stock for that matter. Apple’s earnings could very well be the catalyst for the markets to once again challenge the current triple top formation. Now that we are in August I do think we will get that answer soon enough. I do expect volatility to pick up a bit here in August which is not uncommon for this time of year. The SPY’s (chart) which tracks the S&P 500 (chart) has demonstrated support at its 20-day moving average which is essentially $279.50 and the overhead resistance is essentially the $285.00 zone. Let’s see if the S&P can break away from either line. Good luck to all πŸ™‚

~George

S&P 500 - George Mahfouz Jr.

Triple Top Or Breakout?

After chopping between the 2700 and 2800 zone for the past couple of months, is the S&P 500 (chart) at a triple top, or is it ready to breakout? I think we are going to find out this week in which second quarter earnings reporting season kicks into high gear. Although volatility has reared its head in first half of 2018, vol now has come back to what the markets have been accustomed to over the past few years (see chart below). Whether we breakout and test all time highs is a head scratcher. Of course earnings will play a key role in which way the markets will go, but there are other market moving factors in the mix. Any minute President Trump could put out a tweet on trade which could kill the most recent rally in stocks or propel it to new highs. On Tuesday and Wednesday, Federal Reserve Chairman Jerome Powell will speak in front of the Senate Banking Committee and the House Financial Services Committee. Without a doubt investors will be paying close attention to the tone and context of Chairman Powell’s testimony in front of both committees. Oh yes, we must not forget the Trump/Putin summit and I can’t even guess what comes out of that meeting and how the markets will react. So as you can see, chance are we will breakout of the triple top we are in or pullback within the trading range as mentioned above.

This week kicks off with high flying Netflix (NasdaqGS:NFLX) which reports their quarterly results tomorrow after the close, followed by Goldman Sachs (NYSE: GS) on Tuesday along with Johnson & Johnson (NYSE: JNJ), T-Mobile (NYSE: TMUS) and rounding the week out we will hear from the likes of Alcoa Corp (NYSE: AA), American Express (NYSE: AXP), eBay Inc. (NasdaqGS: EBAY), International Business Machines (NYSE: IBM), Etrade Financial Corp. (NasdaqGS: ETFC), Intuitive Surgical (NasdaqGS: ISRG), Microsoft Corp. (NasdaqGS: MSFT), General Electric (NYSE: GE) and Honeywell International Inc. (NYSE: HON) just to name a few. Good luck to all πŸ™‚

~George

VIX - George Mahfouz Jr.

First Half Of 2018 In The Books…

The first half of 2018 is in the books and where in the world did that go? Year to date the Dow Jones Industrial Average (chart) is off about one percent, the S&P 500 (see chart below)Β is up a couple of percentage points but the Nasdaq Composite (chart) and the small-cap Russell 2000 (chart) are way outperforming the other benchmark indexes closing the first half of the year up almost 10% each.

Let’s take a look how the second half of the year is shaping up. We start off the second half of the year with of course the fourth of July holiday which this year happens to be in the middle of the week. I don’t expect too much market action this upcoming week especially with a shortened trading session on Tuesday followed by the markets closing on Wednesday in recognition of the 4th of July. There could be some positioning going on both Thursday and Friday after the holiday. but all in all I am expecting lighter volume throughout the week with not too much volatility. Now the following week and the second half of the year is a whole different story. Q2 earnings reporting season will begin in earnest the week of July 9th and this my friends will be the true beginning of the second half of the trading year. I expect volatility to kick in once again as corporate America unveils their most recent quarterly results. Furthermore, we will be getting ever closer to the midterm elections that promises to be filled with about as much drama and rhetoric one can imagine. Also, historically stocks have witnessed meaningful corrections at some point during the year leading up to the midterms and I do not expect this year to be any different. I also expect corporate America to report impressive growth to their top and bottom lines; however, these results may already be priced in.

Technically speaking the aforementioned indexes all remain above their respective moving averages with the Dow Jones Industrial Average (chart) hovering right around its 200-day. Paula and I wish everyone a very safe and Happy 4th of July πŸ™‚

~George

S&P 500 - Paula Mahfouz


The Economy Is Booming, But…

There is no question the economy is booming but what does this mean long term for stocks? When the economy is firing on all cylinders like it is now here in the United States one may think the stock market must be ready for its next leg up! Not so fast. Historically when the economy heats up and the unemployment rate becomes so low, that does not typically bode well for stocks. Why you ask? Simply put, the Federal Reserve does not want inflation to rear its head up and their main tool to avert inflationary pressures is to raise interest rates. As counterintuitive as it may seem, a strong economy and low unemployment may be the catalyst to put the brakes on this almost 10 year bull market run. That said, the major averages continue to show extraordinary resilience no matter what comes at it. The Dow Jones Industrial Average (chart) closed the week above 25,000, the S&P 500 (chart) finished the week at 2779, the Nasdaq Composite (chart), finished near its all time high and the small-cap Russell 2000 (see chart below) closed the week out a few points away from it’s all time high as well.

It is quite remarkable how the aforementioned indexes are behaving with all things considered. This past week the Federal Reserve raised interest rates again and signaled two more hikes this year and the trade war chatter and action with China and our own allies for that matter is accelerating. Just these two events alone show be putting selling pressure on stocks not setting new record highs as is the case this past week with the Nasdaq Composite (chart) and the Russell 2000 (chart). These indexes also remain well above key moving averages which at some point in time reversion to the mean should occur. I will be looking for opportunities on the short side but will continue to respect the fact that this years-long bull market remains intact at least from a technical standpoint. Good luck to all πŸ™‚

~George

george mahfouz jr - Russell 2000


Trade War Back On!

Here we go again, the trade war is back on! Donald Trump yesterday once again fired up the trade war this time including the EU, Mexico and Canada. How is an investor supposed to confidently invest when the message and policies of our government change almost daily. Stocks all week have been whipsawed around which is great for the trader, but no so much for the investor. Now we have countries from around the world retaliating with their own tariffs on our goods. The Dow Jones Industrial Average (chart) finished the week at 24635, the S&P 500 (chart) closed the week out at 2734, the Nasdaq Composite (chart) closed at 7554 and the small-cap Russell 2000 (see chart below) showing its incredible resilience finishing the week out near an all-time high.

The chop action that we are seeing in the markets along with the unpredictably of our government gives me more reason now to focus in on the technical trading patterns of stocks and indices. Whether it is support or resistance levels vis Γ  vis moving averages (click here) i.e. the 20-day, 50-day, 100-day, 200-day or outright overbought or oversold conditions using the Relative Strength Index (click here) or the Bollinger Bands (click here) which can also provide a technical look into extreme conditions. With Q1 earnings reporting season essentially wrapped up, there is no real apparent catalyst to move the markets in a meaningful way. Which is why I will be paying much closer attention to the technical make up of the markets to identify opportunities.

One of my favorites are the moving averages (click here) especially the 200-day moving average. For example, just take a look at the Dow Jones Industrial Average (chart) and the S&P 500 (chart). You’ll see over the past few months each time these indexes gravitated to their respective 200-day MA, they found support and proceeded higher. There is no guarantee that moving averages will always hold and provide support, but in many instances it indeed acts as a short term floor to selling pressure. There are many resources on how technical analysis can work and I would recommend studying the dynamics of TA before including it in your investment or trading strategies. Good luck to all πŸ™‚

~George

Russell 2000 - Paula Mahfouz


Strong Earnings Results Buoy Stocks!

Q1 strong earnings results buoy stocks! Corporate profits for this past quarter have exceeded expectations. On average corporate earnings growth surpassed 20 percent for the quarter however, it appears that the markets have priced in this impressive growth. For the most part stocks have had a muted response to their earnings results so far this year. The S&P 500 (chart) is barely up on the year. The Dow Jones Industrial Average (chart) finds itself essentially flat with the Nasdaq Composite modestly upΒ (chart), however, the small-cap Russell 2000 (chart) quietly hit an all time high today. Interestingly enough when small-cap stocks are outperforming the other bellwether indexes, it’s usually a good sign for a rest of the market. We will have to see if history repeats itself here.

Yes the markets as a whole may not be up that much this year, but I am impressed with how the overall landscape has held up. The pending trade war with China, the on again and off again tensions with North Korea and rising interest rates have yet to really take hold of these markets in a negative manner. Yes we did experience a 10% sell-off in February but only to be met with support and a resumption of the upward bias towards stocks. That said, I do feel the markets are teetering on the potential of another pullback. Let’s take a look at the technical shape of the aforementioned indexes.

The Dow Jones Industrial Average (chart) closed just under its 100-day moving average at 24714, S&P 500 (chart) is on the other side of that coin closing just above its 100-day moving average at 2720, the Nasdaq Composite (chart) closed at 7382 and as previously mentioned, the small-cap Russell 2000 (chart) notched an all time high today breaking out of a triple top closing at 1625. So technically speaking these key indexes are not in any type of extreme condition either overbought or oversold and we will have to see how the balance of earnings reporting season plays out and whether or not we break out to the upside or have another retracement. Good luck to all πŸ™‚

~George

A Sell The News Environment?

We are almost at the midway point of earnings reporting season and it appears that we are in a “sell the news” type environment. Amazon (Symbol: AMZN), Intel (Symbol: INTC), Bank of America (Symbol: BAC) JP Morgan Chase (Symbol: JPM) are amongst other high profile companies that have smashed it out of the park with their latest quarterly earnings reports and yet the market does not seem to care. At best stocks have gone sideways with breakout moments only, only to find themselves priced back where they started before their earnings reports. One could say that stocks have already priced in their respective growth and the markets seem to agree. To close out the month of April, the Dow Jones Industrial Average (chart) closed at 24,163, the S&P 500 (chart) finished the month at 2648, the Nasdaq Composite (chart)Β closed at 7066 and the small-cap Russell 2000 (chart) settled at 1542.

As mentioned above, we are around the mid-point of the season and there are still hundreds of companies that are set to report their earnings this week which includes the likes of: Apple (NasdaqGS: AAPL), Devon Energy Corp. (NYSE: DVN), Gilead Sciences Corp. (NasdaqGS: GILD), Snap Inc (NYSE: SNAP), Avis Budget Group (NYSE: CAR), Caesars Entertainment Corp (NYSEL CZR), CVS Health Corp. (NYSE: CVS), Estee Lauder Companies Inc. (NYSE: EL), Holly Frontier Corp. (NYSE: HFC), Mastercard Inc. (NYSE: MA), MetLife Inc. (NYSE: MET), Yum! Brands Inc. (NYSE: YUM), Avon Product Inc. (NYSE: AVP), CBS Corp. (NYSE: CBS), Ferrari NV (NYSE: RACE), Kellogg Co. (NYSE: K), Shake Shack Inc. (NYSE: SHAK), Sprouts Farmers Market Inc. (NasdaqGS: SFM), Weight Watchers International Inc. (NYSE: WTW), Celgene Corp. (NasdaqGS: CELG) and Cheniere Energy Corp (NYSE: LNG). These are just a few of the names that report this week and as you can see there is a wide variety of companies that could potentially move the market from its most recent sideways action. Good luck to all πŸ™‚

~George


Risks Abound!

As we enter into Q1 earnings reporting season there are risks abound! Whether it’s the brewing trade war with China, rising interest rates here at home or geopolitical tensions in the middle east, the risk profile of this market has certainly increased in recent weeks. Money center banks such as JP Morgan Chase (NYSE: JPM), Citigroup (NYSE: C) and Wells Fargo (NYSE: WFC) kicked off earnings reporting season and all reported solid earnings numbers only to see their stocks falter on Friday. So we could be setting up for a better than expected earnings reporting season and the markets won’t care due to the aformentioned risks that are present. We will certainly find out this upcoming week as hundreds of companies are set to report their quarterly results. We kick off the week with earnings from Bank of America (NYSE: BAC), Charles Schwab Corp (NYSE: SCHW), Netflix (NasdaqGS: NFLX) followed by Goldman Sachs (NYSE: GS), Johnson & Johnson (NYSE: JNJ), Intuitive Surgical (NasdaqGS: ISRG), United Continental Holdings (NYSE: UAL), United Healthgroup (NYSE: UNH), Abbot Labs (NYSE: ABT), American Express (NYSE: AXP), Morgan Stanley (NYSE: MS), United Rentals (NYSE: URI), Etrade Financial Corp. (NasdaqGS: ETFC), General Electric (NYSE: GE) Honeywell International (NYSE: HON), Procter & Gamble (NYSE: PG), Schlumberger (NYSE: SLB) and Transunion (NYSE: TRU) just to name a few.

Let’s take a gander at the technical shape of the markets. The Dow Jones Industrial Average (see chart below) has bounced off of its 200-day moving average multiple times over the past couple of weeks and is now hovering at its 20-day, the same can be said for the S&P 500 (chart), the Nasdaq Composite (chart) is right on its 20-day and 100-day moving averages as is the small-cap Russell 2000 (chart). So all of the key indices are at or slightly above key support levels and just maybe between earnings reporting season and key support levels in play, stocks can withstand the risks that are currently present. Good luck to all πŸ™‚

~George

Dow Jones - George Mahfouz Jr


Tech Stocks Under Fire!

Despite a modest rebound on Friday tech stocks remain under fire. From Facebook (NasdaqGS: FB) to Tesla (NasdaqGS: TSLA) and now even Amazon (NasdaqGS: AMZN) are all under pressure for a variety of reasons. This is spilling over into the overall tech sector (see chart below) and even into the overall marketplace. Facebook is facing significant scrutiny regarding user privacy while Tesla continues to trip up with deliveries and debt issues and now even Amazon is under pressure due to President Trump’s direct attack on the online retailer’s sales tax structure. This was enough to send the major averages down to close out the quarter at or in negative territory. The Dow Jones Industrial Average (chart)Β finished Q1at 24103, the S&P 500 (chart) closed the quarter at 2640, the Nasdaq Composite (chart) closed at 7063 and the small-cap Russell 2000 (chart) finished the first quarter of the year at 1529.

What was also obvious in Q1 was how volatility came back to life. For years the market was in a lullaby state melting up and setting record after record. Well the first quarter has swiftly reminded us on how markets can and should behave. Investors that placed money into mutual funds or passive funds over the past several years made out like a bandit with not a worry in the world. Abnormal stock market gains were in vogue especially after the election. Now with rising interest rates, the Federal Reserve reducing its debt load and the daily drama out of Washington DC, I think it is safe to say the melt up mode and daily records being set are in the rear view mirror. That said, market corrections are very normal and healthy and so is volatility at least for traders that is πŸ™‚

Looking ahead and with earnings reporting season right around the corner, let’s see how corporate America fared in the first quarter of the year. This could be the catalyst that calms things down a bit but in the same breath should there be any slippage in earnings growth, we could be in for more even more volatility. Good luck to all πŸ™‚

~George

Nasdaq - george mahfouz jr

Red Week For Stocks, Technicals In Play…

Stocks had a tough week pressured by the prospects of rising interest rates and political turmoil out of Washington D.C. On the week, the Dow Jones Industrial Average (see chart below) closed lower by 1.5%, the S&P 500 (chart) closed the week down 1.2%, the Nasdaq Composite (chart) finished lower by 1% and the small-cap Russell 2000 (chart)Β ended the week down around 1% as well. Despite a choppy and red trading week, all of the aforementioned indexes are still up on the year.

As we celebrate St. Patrick’s Day we find ourselves in a period of no real short term catalysts to steer the market in either direction other than the FOMC meeting next week. I don’t expect the Federal Reserve to surprise the markets with a larger than expected interest rate hike or change their view on interest rate policy this year. The inflation data continues to remain tame although the labor market is heating up. So what is going to drive stocks between now and Q1 earnings reporting season in April?

When we find ourselves in a period such as the one we are in, I focus in on the technical shape of the markets. And as you can see in the charts of the major averages, all of them are at theirΒ moving averages support. Whether it’s the 9 day, 20 day, 50 day, 100 or 200 day moving average, stocks and indexes typically respect and is supported by moving average support lines with the 200 day moving average being the most reliable out of all of them. This doesn’t mean that this favorite technical indicator of most market technicians is infallible, but it sure has a history of being an effective tool when navigating the markets. All things considered, including the seasonality of the markets, I do expect that these support levels should hold at least until Q1 earnings reporting season. If the moving averages don’t hold, then I would not be surprised if we revisit the early February market correction lows. Good luck to all and Paula and I wish everyone a safe and Happy St. Patricks Day πŸ™‚

~George

Dow Jones Industrial Average - Paula Mahfouz