Strong Economy Equals A Strong Stock Market!

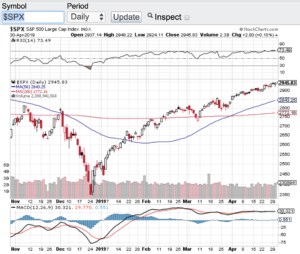
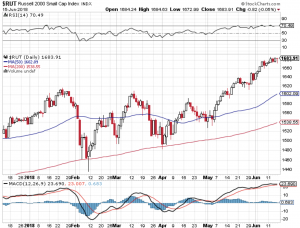
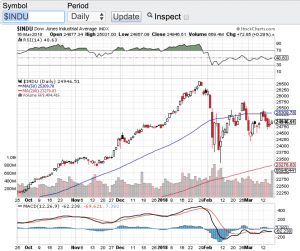
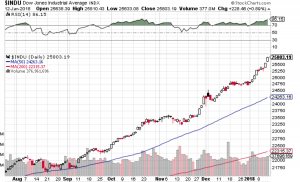
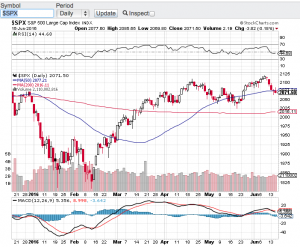
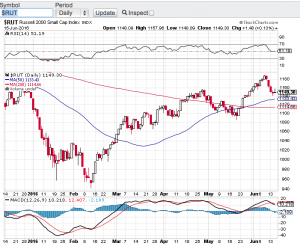
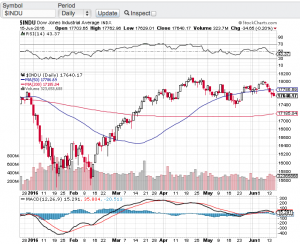
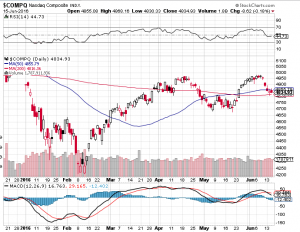
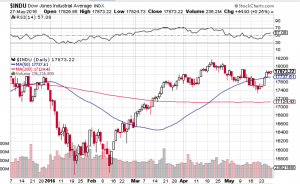
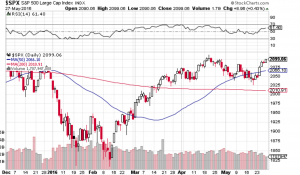
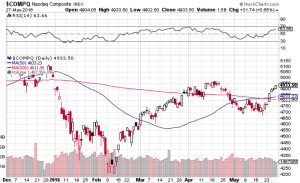
The economy posted a 3.2% gain in the first quarter and as the saying goes, a strong economy equals a strong stock market! Is it any wonder as to why the Nasdaq Composite (see chart here) hit an all-time high on Monday! The same rings true with the S&P 500 (see chart below). The S&P 500 hit an all-time high on Monday as well. Now the Dow Jones Industrial Average (see chart here) has a bit more work to do in order to tap its own record as does the small-cap Russell 2000 (see chart here). However, I am sure the bulls will take 2 out of the 4 major averages setting all time highs. What is also helping the stock market is how the Federal Reserve has taken a cautious approach to raising rates any further. In fact, there are calls out of Washington DC asking the Fed to start lowering rates to stimulate the economy even further. Now I am not so sure that the Fed will accommodate Washington’s request, but I do think it is safe to say that we should not see a rate hike in the near future or maybe not at all for the rest of this year.

One note of caution to me is that with nearly half of corporate America reporting their Q1 earnings so far, we are seeing on average a year over year decline in earnings. There are still 100’s of companies set to report over the coming weeks but if this trend continues, this will be the first year over year decline in corporate earnings in years. I will be keeping an eye on this development.

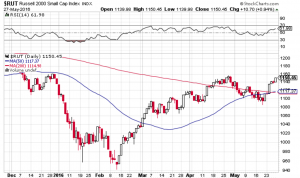
The technical shape of the aforementioned indexes remain intact. The Dow, Nasdaq, S&P 500 and the Russell 2000 all are trading above their respective key moving averages. However, both the Nasdaq Composite (see chart here) and the S&P 500 (see chart here) have entered into overbought territory according to the relative strength index also know as the RSI. That said, I would not be surprised to see at the very least some consolidation or an outright healthy pullback. Good luck to all 🙂

~George

S&P 500 - Paula Mahfouz

The Economy Is Booming, But…

There is no question the economy is booming but what does this mean long term for stocks? When the economy is firing on all cylinders like it is now here in the United States one may think the stock market must be ready for its next leg up! Not so fast. Historically when the economy heats up and the unemployment rate becomes so low, that does not typically bode well for stocks. Why you ask? Simply put, the Federal Reserve does not want inflation to rear its head up and their main tool to avert inflationary pressures is to raise interest rates. As counterintuitive as it may seem, a strong economy and low unemployment may be the catalyst to put the brakes on this almost 10 year bull market run. That said, the major averages continue to show extraordinary resilience no matter what comes at it. The Dow Jones Industrial Average (chart) closed the week above 25,000, the S&P 500 (chart) finished the week at 2779, the Nasdaq Composite (chart), finished near its all time high and the small-cap Russell 2000 (see chart below) closed the week out a few points away from it’s all time high as well.

It is quite remarkable how the aforementioned indexes are behaving with all things considered. This past week the Federal Reserve raised interest rates again and signaled two more hikes this year and the trade war chatter and action with China and our own allies for that matter is accelerating. Just these two events alone show be putting selling pressure on stocks not setting new record highs as is the case this past week with the Nasdaq Composite (chart) and the Russell 2000 (chart). These indexes also remain well above key moving averages which at some point in time reversion to the mean should occur. I will be looking for opportunities on the short side but will continue to respect the fact that this years-long bull market remains intact at least from a technical standpoint. Good luck to all 🙂

~George

george mahfouz jr - Russell 2000


Red Week For Stocks, Technicals In Play…

Stocks had a tough week pressured by the prospects of rising interest rates and political turmoil out of Washington D.C. On the week, the Dow Jones Industrial Average (see chart below) closed lower by 1.5%, the S&P 500 (chart) closed the week down 1.2%, the Nasdaq Composite (chart) finished lower by 1% and the small-cap Russell 2000 (chart) ended the week down around 1% as well. Despite a choppy and red trading week, all of the aforementioned indexes are still up on the year.

As we celebrate St. Patrick’s Day we find ourselves in a period of no real short term catalysts to steer the market in either direction other than the FOMC meeting next week. I don’t expect the Federal Reserve to surprise the markets with a larger than expected interest rate hike or change their view on interest rate policy this year. The inflation data continues to remain tame although the labor market is heating up. So what is going to drive stocks between now and Q1 earnings reporting season in April?

When we find ourselves in a period such as the one we are in, I focus in on the technical shape of the markets. And as you can see in the charts of the major averages, all of them are at their moving averages support. Whether it’s the 9 day, 20 day, 50 day, 100 or 200 day moving average, stocks and indexes typically respect and is supported by moving average support lines with the 200 day moving average being the most reliable out of all of them. This doesn’t mean that this favorite technical indicator of most market technicians is infallible, but it sure has a history of being an effective tool when navigating the markets. All things considered, including the seasonality of the markets, I do expect that these support levels should hold at least until Q1 earnings reporting season. If the moving averages don’t hold, then I would not be surprised if we revisit the early February market correction lows. Good luck to all and Paula and I wish everyone a safe and Happy St. Patricks Day 🙂

~George

Dow Jones Industrial Average - Paula Mahfouz

1000 Points In 7 Trading Days?

I am not even sure what to say here, almost 1000 points in 7 trading days? After closing above the 25,000 mark for the first time ever on January 4th, the Dow Jones Industrial Average (see chart below) is now closing in on the 26,000 mark in a matter of days. I simply do not understand how this bellwether index can notch 1000 point gains in such a short period of time. In fact most of the major averages are continuing to set records almost daily. How long can this go on? Without question we are on the brink of the strongest bull market in recorded history. The Dow Jones Industrial Average (chart) closed the week at a record 25,803.19, the S&P 500 (chart) closed at a record 2,786.24, the Nasdaq Composite (chart) closed at a record high of 7,261 and the small-cap Russell 2000 (chart) closed the record setting week at 1,591.90. The market was boosted on Friday in part by the strong quarterly earnings results of JP Morgan Chase.

Speaking of earnings reporting season, this week truly is the start of earnings reporting season in which most analysts expect strong top and bottom line growth from corporate America. Over the past few years the markets did witness strong bottom line growth in which a lot of that growth was due to improved efficiencies and reductions of the workforce. Now the opposite is occurring. The economy is expanding as is the job market. This should bode well for not only company earnings but for the continuation of the bull market. That said, I would think that a pullback of any kind is in the cards and I would also expect that investors and traders would be there in support of a retracement.

From a technical point of view equites are clearly overbought according to the relative strength index also referred to as the RSI. However, this favorite technical indicator has not provided the guidance and reliability as it usually does simply because these markets have remained overbought for one of the longest stretches I can remember. There will be a time where the RSI will become more reliable as it once was, but in my humble opinion you will need a “normal” market environment for this to be the case. Good luck to all 🙂

~George

dow jones - george mahfouz jr

New Year, New Records?

Happy New Year! Will 2018 be a new year of new records? Nothing would surprise me. Especially as the Dow Jones Industrial Average (chart), the S&P 500 (chart), the Nasdaq (chart) and the small-cap Russell 2000 (chart) shattered record after record after record in 2017. In fact the Dow Jones Industrial Average set 70 record closing highs in 2017. That’s not a typo folks, 70 record closing highs. The other aforementioned key indices also set multiple record highs throughout last year. So could we see a repeat performance in 2018? I don’t know about another 70 record highs this year but I would not be surprised to see continuing strength in the markets in 2018. Yes the Federal Reserve is now in a rate hike mode which typically does not bode well for stocks, but this Fed and central banks from around the world understand the need to go about their new rate hike policies in a gradual manner. Raising rates too aggressively could be the exact catalyst to put the brakes on this almost decade long bull market. I don’t think this will be the case at least with our own Federal Reserve. Jerome Powell will be replacing Janet Yellen in early February as our new Federal Reserve Chairman. Mr. Powell who has been a member of the Federal Reserve’s board of governors since 2012 has voted for keeping interest rates at bay while the economy continues to recover.

Speaking of the economy, expansion continues to occur and we will soon find out how our economy is  trickling down into corporate America. Fourth quarter earnings reporting season will begin here in January and this could very well serve as a key catalyst for the continuation of the bull market. That said, I think most investors and traders are looking for the markets to pause and pullback from this historic run we continue to be on. It is truly breathtaking to witness the record pace that stocks have enjoyed for years now. Personally, I hope and some point in time we do get a meaningful pullback so we can have the opportunity to step in at lower prices. Good luck to all and Paula and I wish everyone the healthiest and happiest new year! 🙂

~George

Big Time For Big Tech!

Large cap tech stocks have taken center stage this earnings reporting season big time! Absolute blowout earnings reports came in from Amazon (NasdaqGS: AMZN), the parent company of Google, Alphabet (NasdaqGS: GOOGL) and the elders of the group Intel Corp (NasdaqGS: INTC) and Microsoft (NasdaqGS: MSFT). These tech titans are the latest reason for the Nasdaq (chart) and S&P 500 (chart) to reach and close at record highs yet again. The Dow Jones Industrial Average (chart) and the small-cap Russell 2000 (chart) are also within striking distance of their all times highs. Market observers have attributed the strength in stocks this year to a continuing low interest rate environment and the upcoming new tax policy from the Trump administration. This I get, however, no one can deny the growth that is happening in the tech world as well as other sectors of the economy.

The one note of caution I have here is the exuberant environment we find ourselves in with record highs happening weekly and in some instances daily. Yes earnings reporting season so far has been stellar but let’s not forget that we have not seen price to earnings ratios this elevated in quite some time. The question that now comes to mind are the markets and the aforementioned stocks finally at fair value? Especially as the p/e’s increase and as we approach a much higher interest rate environment over the next two years. We have been in such an accommodative monetary state for almost a decade which without a doubt has been the catalyst for equities and indexes and now the federal reserve here in the U.S. is reversing course. One of the groups that get the most affected in a higher interest rate environment are growths stocks like the aforementioned tech titans.

I am not suggesting that these stocks will not continue their upward trajectory, but I am making note and will be paying closer attention to the overall price to earnings ratios of the indexes and of high growth stocks in general as p/e’s continue to elevate. Good luck to all 🙂

~George

Looks Like A Double Top…

A recent attempt to breakout to all-time highs has seemingly failed. The Dow Jones Industrial Average (see chart below) , the tech-focused Nasdaq (see chart below), the S&P 500 (see chart below) and the small-cap Russell 2000 (see chart below) all appear to have “double topped” and have retreated to support lines. Without question growth concerns here in the United States are abound. These concerns escalated right after the release of May jobs report which was dismal to say the least. Couple these concerns with the potential of the United Kingdom leaving the European Union and its no wonder why the markets have pulled back over the past couple of weeks.

One of the risks to the markets that I highlighted in my last blog were interest rates. It appeared at the beginning of the month that the Federal Reserve and market pundits were all but certain that a rate hike would occur at today’s Federal Reserve meeting. Well thanks to the underwhelming May jobs report, no rate hike occurred this month and furthermore the Federal Reserve have lowered their outlook for any near term future increases! The Fed did say that they will be monitoring our economy and the data to guide them in their future policy decisions and sure enough they continue to stand by this protocol.

Now what? First for me, I want to see how the market reacts to next Thursday’s vote as to whether or not Britain leaves the European Union? Momentum does appear to be increasing for a British exit, which could lead to a global slowdown? Nobody knows if the referendum will pass or what type of effect this will have across the pond or here in the U.S. In the meantime, I will be monitoring the technical shape of our key indices and as you can see in the below charts each of these indexes have found support at either the 20-day, 50-day or 200-day moving averages.

Good luck to all 🙂

~George Mahfouz, Jr.

george mahfouz jr SPX chart

george mahfouz, jr Russell chart


george mahfouz jr Dow chart

george mahfouz jr nasdaq chart

Rate Hikes Are Looming…

Janet Yellen the chair of the Federal Reserve last Friday signaled that the Federal Reserve is prepared to raise interest rates in the coming months should the U.S. economy continue to improve. Some pundits suggest that a rate hike could come at the Fed’s next policy meeting in two weeks. Despite the rate hike chatter, the markets continue to shrug off what seemingly could be bearish for stocks. The Dow Jones Industrial Average (see chart below) is within striking distance of all time highs. Same can be said for the S&P 500 (see chart below), the Nasdaq (see chart below) finds itself flirting once again with the 5000 mark and the small-cap Russell 2000 (see chart below) appears to have caught a bid and is strengthening.

This type of market activity is counterintuitive when interest rates appear to be heading north. The flip side to this thinking is if the Federal Reserve is willing to raise rates due to a stronger economic back-drop, one can assume that this must be good for corporate America. Logically speaking I agree, however, if history has anything to do with the markets, a rising interest rate environment typically does not bode well for equities. Couple this with the seasonality of the summer months which tend to be weaker months for stocks and the upcoming fall presidential election, and I would say at the very least we will see a rise in volatility. These are very powerful forces that are lining up and I think it’s safe to say the markets will be very reactive to these events.

So what’s a trader or investor do in this landscape? For me personally I think the type of environment we are heading into creates opportunity on the long and short side. I will be paying close attention to overbought and oversold conditions of the markets and select equities throughout the summer and into the fall. As everyone knows by now my favorite technical indicator when it comes to spotting overbought/oversold conditions is the Relative Strength Index also known as the RSI. Many market technicians also favor this technical indicator when assessing market conditions from a technical standpoint. Over the years the RSI has demonstrated its usefulness and if you are not familiar with this technical indicator, you may want to research it out. Click here for starters.

Both Paula and I wish everyone a very safe, prosperous investing and trading summer 🙂

~George Mahfouz, Jr.

Screen Shot 2016-05-30 at 8.00.40 PMGeorge Mahfouz Jr. S&P 500 chartGeorge Mahfouz Jr. Nasdaq ChartGeorge Mahfouz Jr. Russell 2000 Chart


Happy New Year!

2015 essentially proved to be a flat to down year for stocks taking some investors and traders by surprise. The Dow Jones Industrial Average (chart) closed the year down 2.2%, the S&P 500 (chart) minus dividends closed down just under 1%, the Nasdaq (chart) closed up 5.73% and the small-cap Russell 2000 (chart) closed the year down 5.71%. What’s more is how crude oil (chart) fared in 2015 declining more than 30% which also had weighed heavily on the aforementioned indices.

Looking ahead to this year, stocks find themselves in a place where they haven’t been in quite sometime and that is a rising interest rate environment. Historically speaking, equities tend to be under pressure at the beginning of and throughout a rate hike cycle with the exception of cyclical stocks and certain commodities. However this time may be different. In the past when the Federal Reserve begins to raise interest rates it is usually to fend off inflation and/or to cool off the economy when it becomes too hot. From my view and from the data flow, this is not the environment we find ourselves in today. So I do not expect that the Federal Reserve would raise rates aggressively or too quickly. With that said, the markets might not trade the way they would if we were in an inflationary environment with rising interest rates. Nonetheless, I do think that more volatility will come into stocks in 2016 and it will become more of a stock pickers market.

Furthermore, the technical shape of the market appears to be setting up for more downward movement as the key indexes have breached or are about to breach their respective 200-day moving averages. However, it would take days of trading below their 200-day to set off an alarm at least from a technical perspective. Let’s see how the first week of trading in the new year plays out before making any sort of definitive technical opinion.

Both Paula and I sincerely wish everyone the healthiest, happiest, safest and most prosperus New Year yet 🙂

~George