Fear Of A Global Pandemic Grips Markets!
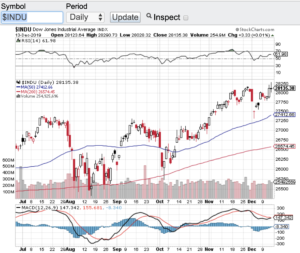
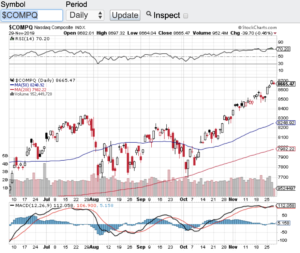
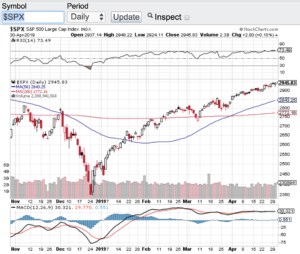
Stocks went into a tailspin as fear of a global pandemic grips the markets! New outbreak clusters of the highly contagious coronavirus are beginning to surface which is pressuring leaders from around the world to act and act more aggressively. Stocks have also entered correction territory as companies and analysts begin to ratchet down their revenue and earning forecasts. Over the past week or so the Dow Jones Industrial Average (see chart here) has lost over 10% in the past week alone, the S&P 500 (see chart here) has also entered into correction mode, the Nasdaq Composite (see chart here) has been hit hard and the small-cap Russell 2000 (see chart here) is also witnessing a sharp sell-off.
Personally I believe a correction was needed because of how robotic the markets have acted. Stocks no matter what risks were out there behaved in a way never before seen. We have been in the strongest bull market ever and nothing over the past 12 years could slow this bull market down. Now I am not happy that it is a global health risk that’s the catalyst to put stocks in correction mode, but nonetheless this is where we find ourselves. Of course when fear is rampant in any market this is where opportunity can be found. I am not suggesting to jump in here because as we all know fear and/or greed can be excessive and markets tend to over do it when emotions take the lead over rational thinking. So when we get overextended to the upside or downside the first thing I look at is how the technicals look during extreme market moves.
When I now look at the technical shape of the markets at least at it pertains to the moving averages things do not look so good. The Dow Jones Industrial Average (see chart here), the S&P 500 (see chart here) and the Russell 2000 (see chart here) have all breached their 20-day, 100-day and 200-day moving averages which are all seen as major support zones especially the 200-day. The Nasdaq Composite (see chart here) is the only major index that has yet to close below its 200-day. That said, all of the aforementioned indexes are oversold according to the relative strength index (RSI) which when we see the 20 value level hit on any stock or index, snap back rallies can and do occur. This type of market is great for traders if you are experienced enough to trade off of technicals, however for investors that have a long term view these type of market environments requires a lot of patience and keeping the emotions at bay. Let’s all hope that the spread of the coronavirus abates and that a vaccine becomes available as quickly as possible.
Good luck to all 🙂
~ George