2024, A Record Setting Year!

The year 2024 was a record setting year for stocks! The Dow Jones Industrial Average (see chart here) set record high in 2024 trading over the 45000 mark, the S&P 500 (see chart here) also set a record high before year end trading over the 6000 mark. The Nasdaq Composite (see chart here) joined the record high club as well trading over the 6000 mark as did the small-cap Russell 2000 (see chart here).

As 2024 unfolded, seemingly record high after record high was hit. Furthermore, as the S&P 500 (see chart here) hit an all-time high in December trading up over 23% on the year, The S&P in 2023 also notched record gains so between 2023 and 2024 the S&P 500 is up over 50% in total over the past two years. Needless to say, I think we may be a bit overbought, especially as I look at the price to earnings ratio of the S&P 500 which closed the year just under a 30 p/e ratio. Now to put this into perspective, the S&P 500’s historical price to earnings ratio average trades in the 15-17 p/e zone. Yes, the current price to earnings ratio of the S&P 500 is nearly twice the historical average.

Something must give here in 2025. Either the economy takes off to where corporate America can earn the right to maintain a 30 p/e, or the markets eventually find a way to revert to the mean. Why have we seen such a strong performance in stocks and other asset classes? Simply put, the liquidity that has been pumped into the system for years now continue to be put to work in the markets. Plus, when you add in the policies of the incoming administration, especially on the tax rate side of the equation it’s no wonder why we keep setting records across the board.

Overall, I am optimistic here in 2025 pertaining to stocks, the economy and how the Federal Reserve will manage interest rates. However, I would not be surprised to see an increase in volatility especially as everyone awaits to see how this new administration will execute.

Happy New Year and good luck to all 🙂

~George

Tech Stocks Hit The Brakes!

After going up in a straight line for months, the technology sector (see chart below) has reversed its upward course. After hitting an all-time high of 6341.70 on June 9th, the Nasdaq (chart) has given back 190 points or three percent while approaching its 50-day moving average. Nowadays it’s pretty rare to see a one percent pullback in tech stocks let alone a three percent retracement in a week. The media is now all over how tech stocks today are beginning to resemble the internet bubble. The difference between today and yesteryear is that the top five tech stocks – Amazon (NasdaqGC: AMZN), Apple (NasdaqGC: AAPL), Facebook (NasdaqGS: FB) Google’s parent company Alphabet (NasdaqGC: GOOGL) and Microsoft (NasdaqGC: MSFT) have been responsible for a big chunk of the Nasdaq and S&P 500 (chart) recent gains. The problem with comparing today’s market with the internet bubble is that the aforementioned tech leaders all have incredible balance sheets while continuing to grow at a pace that supports their relative stock prices. One may argue that Amazon remains overpriced especially with its lofty P/E ratio.

It’s hard to imagine that anyone would be concerned about a three percent pullback in any stock or index, but because of how strong stocks have been since the election, anything other than a flat to up day will get noticed. That said, without question all eyes will be on whether or not the Nasdaq’s 50-day moving average will get tested. The last time the Nasdaq (chart) did not hold its 50-day support line was last October. Since then tech stocks have tested and moved off of its 50-day average multiple times. 6085 is the current the 50-day moving average of the Nasdaq which is about 65 points away. I am not suggesting it will go there, but if it does and according to the way tech stocks have reacted to that particular support line, a bounce could be in the cards. Good luck to all 🙂

~George
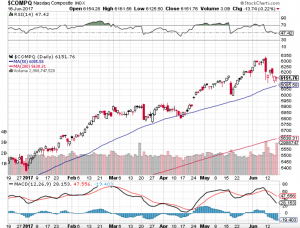
Nasdaq chart - George Mahfouz Jr