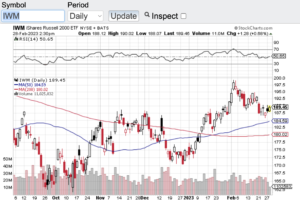
As the markets closed out the month of February, the major averages are approaching a key technical point and the question now becomes, will it hold? As stocks continue to exhibit volatility the major averages are now approaching their 200-day moving average. Institutional investors, hedge funds and individual investors view the 200-day moving average as a key support technical indicator. Historically when indexes or individual stocks gravitate to their 200-day support level at minimum some sort of bounce occurs from this key support line. If you go back over time whether it’s months or years and look at what happens when stocks or indexes retrace to their 200-day, this will demonstrate how powerful this support line can be. Now there is no guarantee that the 200-day will hold every time and reverse its course but see for yourself how this dynamic historically performs.
The Dow Jones Industrial Average (see chart here) is in striking distance of its 200-day moving average which is currently at the 32355 level. The S&P 500 (see chart here) is only about 90 points away from its 200-day. The Nasdaq Composite (see chart here) almost touched its 200-day yesterday and the small-cap Russell 2000 (see chart here and below) is currently further away from its 200-day compared to the Dow Jones, Nasdaq Composite, and the Russell 2000. So technically speaking the small caps are currently in a better technical set up vs the other major averages.
As far as what to expect here in March, I think things will continue to be a bit choppy and should the indexes continue to retrace and end up at or near their 200-day moving average, let’s see how this technical indicator responds should it get there. As always, please consult with certified financial planners before you make any moves or adjustments in your portfolio.
Good luck to all 🙂
~George
